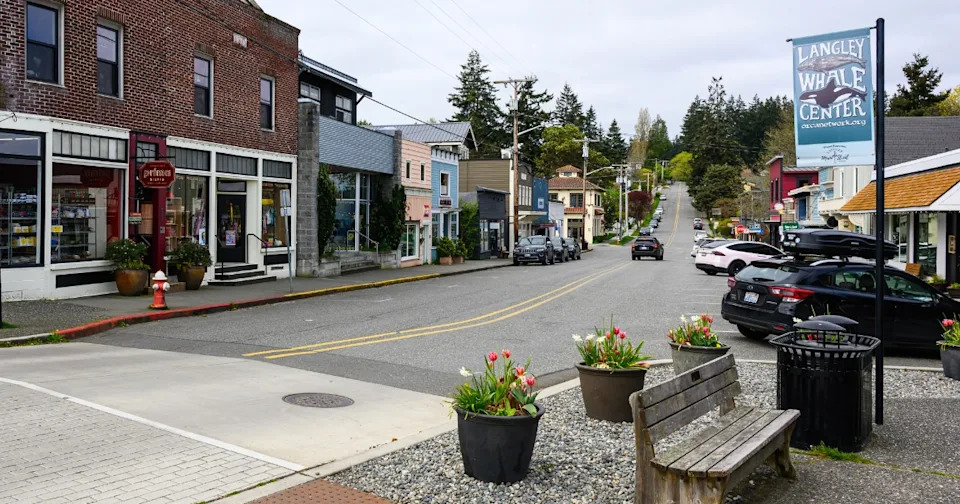
First Street in downtown Langley on a cloudy afternoon. Photo courtesy of a friend, used with permission.
Class topic: MATH& 146, Sections 3.1 and 3.2 — measures of center (mean, median) and spread (standard deviation, the Empirical Rule).
When I was a kid in Langley, Halloween meant cars parked end to end down Anthes, Al Anderson, Cascade, Camano, Park and Sixth Street. A new group of trick-or-treaters knocked on the door about every five minutes. We ran out of candy.
These days I get one or two knocks, and they’re mostly teenagers.
I’ve lived on Whidbey Island for about 26 years, on and off: as a kid, then again after college and work abroad. That’s about three-quarters of my life. Some days I work early shifts in Langley, from about 7 a.m. into the early afternoon. Outside tourist season, I might see one person under 30 the whole time.
Nobody counts trick-or-treaters. But the Census counts everyone’s age every ten years, and every public school reports how many students it has every fall. So I asked: where did Langley’s kids go, and how unusual is Langley compared with every other town in Washington?
Where the numbers come from
I used three public sources.
The U.S. Census counts every person in the country every ten years. Because it’s a full count (everyone, not a sample), there’s no margin of error to report. I used the 2000, 2010 and 2020 counts for Langley, for Washington, and for all 281 of the state’s incorporated cities and towns.
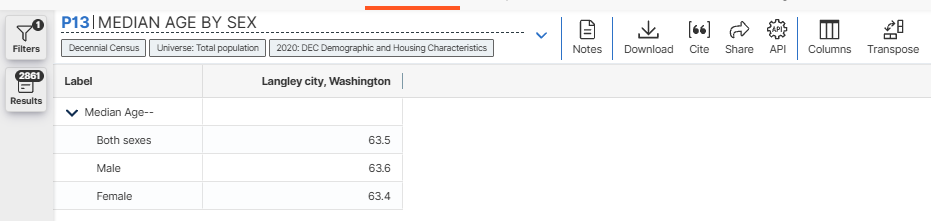
The 2020 Census table for Langley: median age 63.5.1
The American Community Survey (ACS) is the Census Bureau’s yearly survey. It asks only a sample of households, a smaller group that stands in for everyone, and pools five years of answers for small towns. The newest covers 2020 to 2024. Because it’s a sample, each number comes with a margin of error.
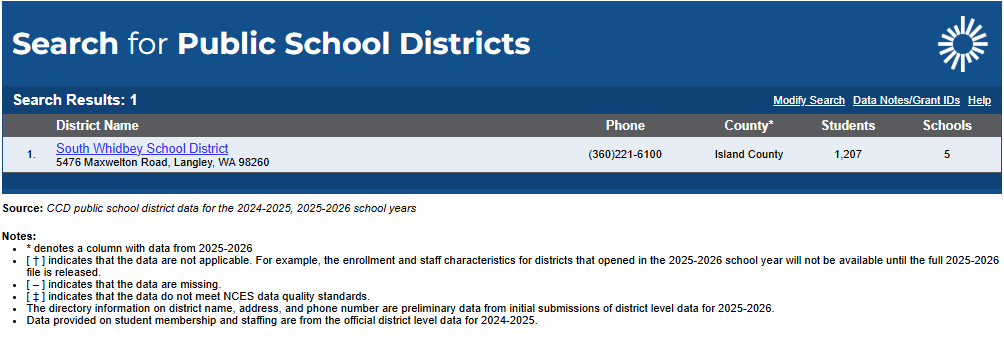
School enrollment comes from the federal Common Core of Data, run by the National Center for Education Statistics (NCES). Every public school district reports its students each fall. I pulled the South Whidbey School District’s totals back to 1987. For the newest year, 2025–26, I used Washington’s school office (OSPI), because the federal data runs a year behind.
The NCES district search for South Whidbey: 1,207 students in 2024–25.2
What I did in R
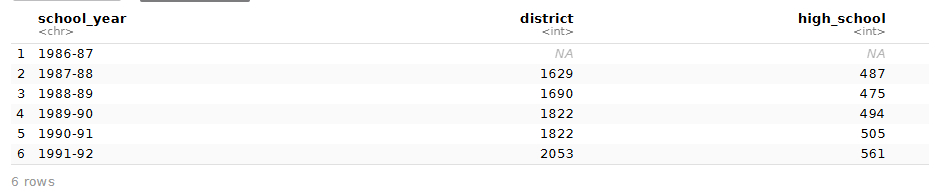
My three tables in R.
Show the code
enroll <-read.csv("south-whidbey-enrollment.csv") # one row per school yearages <-read.csv("age-summary.csv") # Langley, Washington and the school districttowns <-read.csv("wa-towns-median-age-2020.csv") # every WA city and town, 2020 Censusnrow(towns)head(enroll[, c("school_year", "district", "high_school")])
A script (prepare-data.R, in this post’s folder) downloaded everything straight from the Census Bureau, the Urban Institute’s portal and OSPI, saved untouched copies, and built these three small tables. Anyone can rerun it.
First, I checked my memory
Before looking at ages, I wrote down what I remembered about South Whidbey High School: about 1,300 students around 2000, about 900 when I graduated in 2011, and about 480 now.
The high school itself peaked a bit later, at 807 students in 2002–03. The newest federal count, for 2024–25, is 390: less than half the peak. (The 405 above is the state’s count for this school year, one year newer than the federal data.)
My numbers were too high every time, by about 1.2 to 1.7 times. But I had the direction right: the high school has about half as many students as it did in 2000. Memory is good at “a lot more” and bad at “how many more.” That’s why we count.
Show the code
library(ggplot2)ggplot(subset(enroll, !is.na(district)), aes(x = fall, y = district)) +# fall 1986 has no countgeom_line(colour ="#1a4f8b", linewidth =1) +geom_point(colour ="#1a4f8b", size =1.6) +geom_vline(xintercept =c(2009, 2017), linetype ="dashed", colour ="grey40") +annotate("text", x =2009, y =2550, label ="2009: primary\nschool closes", hjust =1.05, size =3.3) +annotate("text", x =2017, y =2550, label ="2017: Langley Middle\nSchool closes", hjust =-0.05, size =3.3) +scale_y_continuous(limits =c(0, 2700), labels = scales::comma) +labs(x ="Fall of school year", y ="Students",title ="South Whidbey School District enrollment, 1987–2025",subtitle ="Every public school student in the district, counted each fall",caption ="Source: NCES Common Core of Data (via Urban Institute) through fall 2024; OSPI for 2025–26.") +theme_minimal(base_size =12) +theme(plot.title.position ="plot")
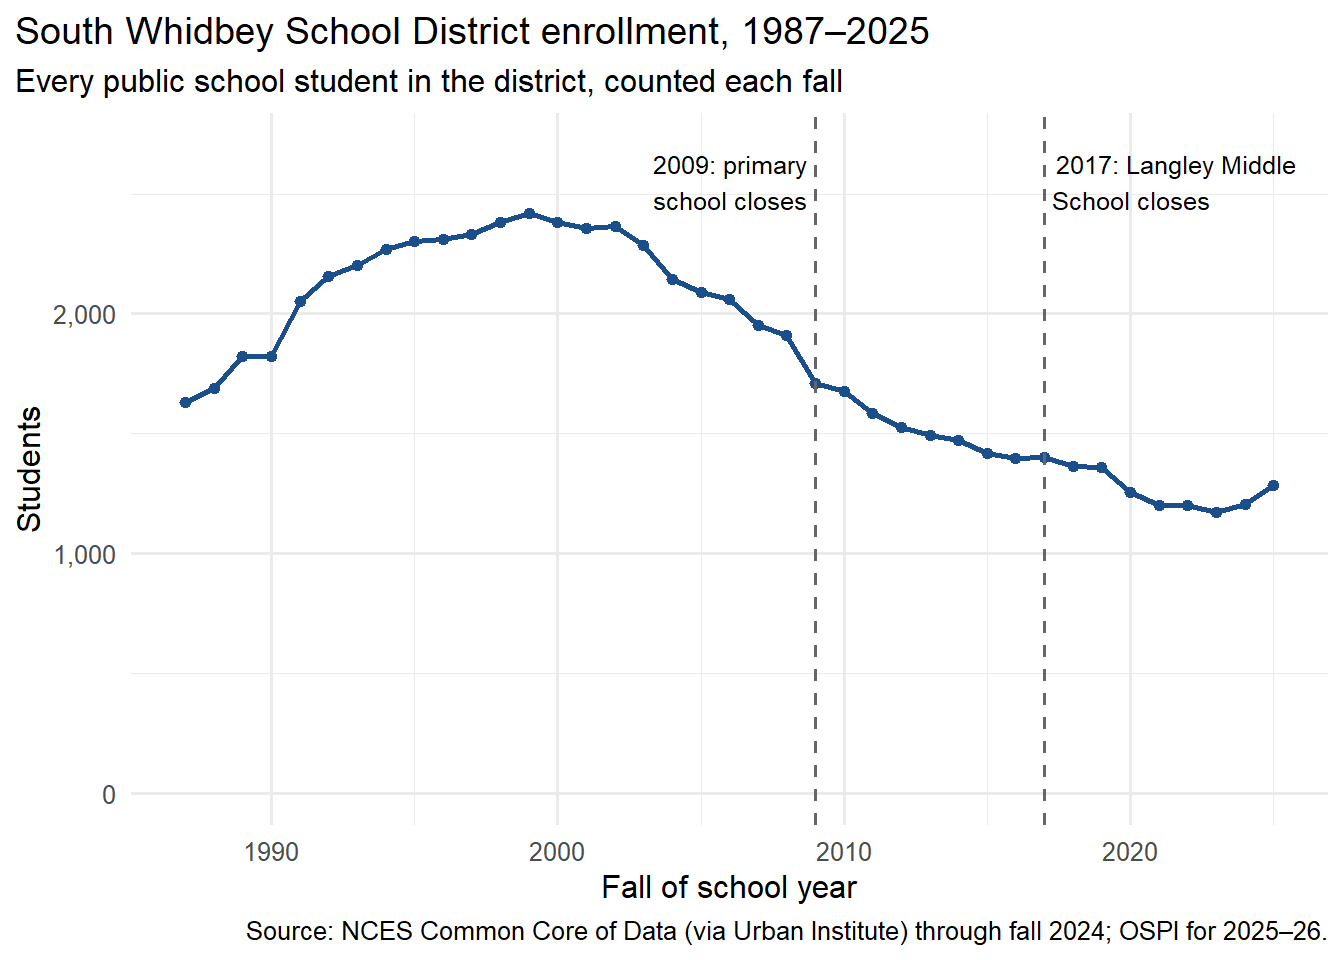
District enrollment peaked at 2,419 students in fall 1999. By fall 2023 it had fallen to 1,173, less than half. It has ticked up since, to 1,284 in 2025–26, but that’s a gain of about 100 after a loss of about 1,250.
The buildings followed the students. In 2009 the district closed the primary school on Maxwelton Road and moved kindergarten through fifth grade into the intermediate building, citing falling enrollment and a budget gap (South Whidbey Record, Feb. 2009). The board voted that same year to close Langley Middle School (July 2009), but it stayed open until June 2017, when a budget shortfall tied to falling enrollment finally closed it (Dec. 2016, May 2017).
The middle of the town: median age
A town’s median age is the age of the person in the middle: line everyone up from youngest to oldest, and half are younger, half are older. The Census reports a median age rather than the mean (the plain average). The median is the better “middle” here because it isn’t pulled around by a few very young or very old people. A statistician calls that resistant.
Show the code
census <-subset(ages, source =="Census (full count)"& area %in%c("Langley", "Washington"))census[, c("area", "period", "population", "median_age", "under18_pct")]
Census year
Langley median age
Washington median age
Langley share under 18
Washington share under 18
2000
48.7
35.3
19.7%
25.7%
2010
57.0
37.3
14.0%
23.5%
2020
63.5
38.1
12.0%
21.8%
By 2020, half of Langley’s residents were 63.5 or older. In 20 years, the middle Langley resident got 14.8 years older; the middle Washingtonian got 2.8 years older. Langley’s population actually grew, from 959 people to 1,147, while the number of kids fell from 189 to 138.
How far out is Langley? Standard deviation
“Old” only means something compared with other places. To compare, I need a way to measure how spread out towns are. That’s the standard deviation: the typical distance between one value and the average.
Here’s how to compute one by hand, using five towns I know well: three on Whidbey and two on the mainland side of my ferry (2020 Census median ages):
Show the code
five <-subset(towns, town %in%c("Langley city", "Coupeville town", "Oak Harbor city", "Mukilteo city", "Everett city"))five$distance_from_mean <- five$median_age -mean(five$median_age)five$distance_squared <- five$distance_from_mean^2fivemean(five$median_age) # 1. the averagesd(five$median_age) # 2-5. R does the rest in one step
The five towns in R, with each one’s distance from the average.
Find the average. (63.5 + 55.9 + 31.3 + 44.0 + 36.7) ÷ 5 = 46.28 years.
Measure each town’s distance from it. Langley is 17.22 years above; Oak Harbor is 14.98 below.
Square each distance. Otherwise the pluses and minuses cancel out and add to zero. Squaring also makes every distance positive.
Average the squares, dividing by one less than the number of towns (5 − 1 = 4). That gives 177.6. (Dividing by n − 1 instead of n is the class rule for a sample; with hundreds of towns it barely matters.)
Take the square root to get back to years: 13.3 years. That’s one standard deviation.
So for these five towns, a “typical” town sits about 13 years from the average. Now the same thing for all 281 cities and towns in Washington:
Show the code
m <-mean(towns$median_age); s <-sd(towns$median_age)langley <- towns$median_age[towns$town =="Langley city"]data.frame(towns =nrow(towns),mean =round(m, 1), median =median(towns$median_age), sd =round(s, 2),langley = langley,langley_sds_above_mean =round((langley - m) / s, 2))
The summary for all 281 towns in R.
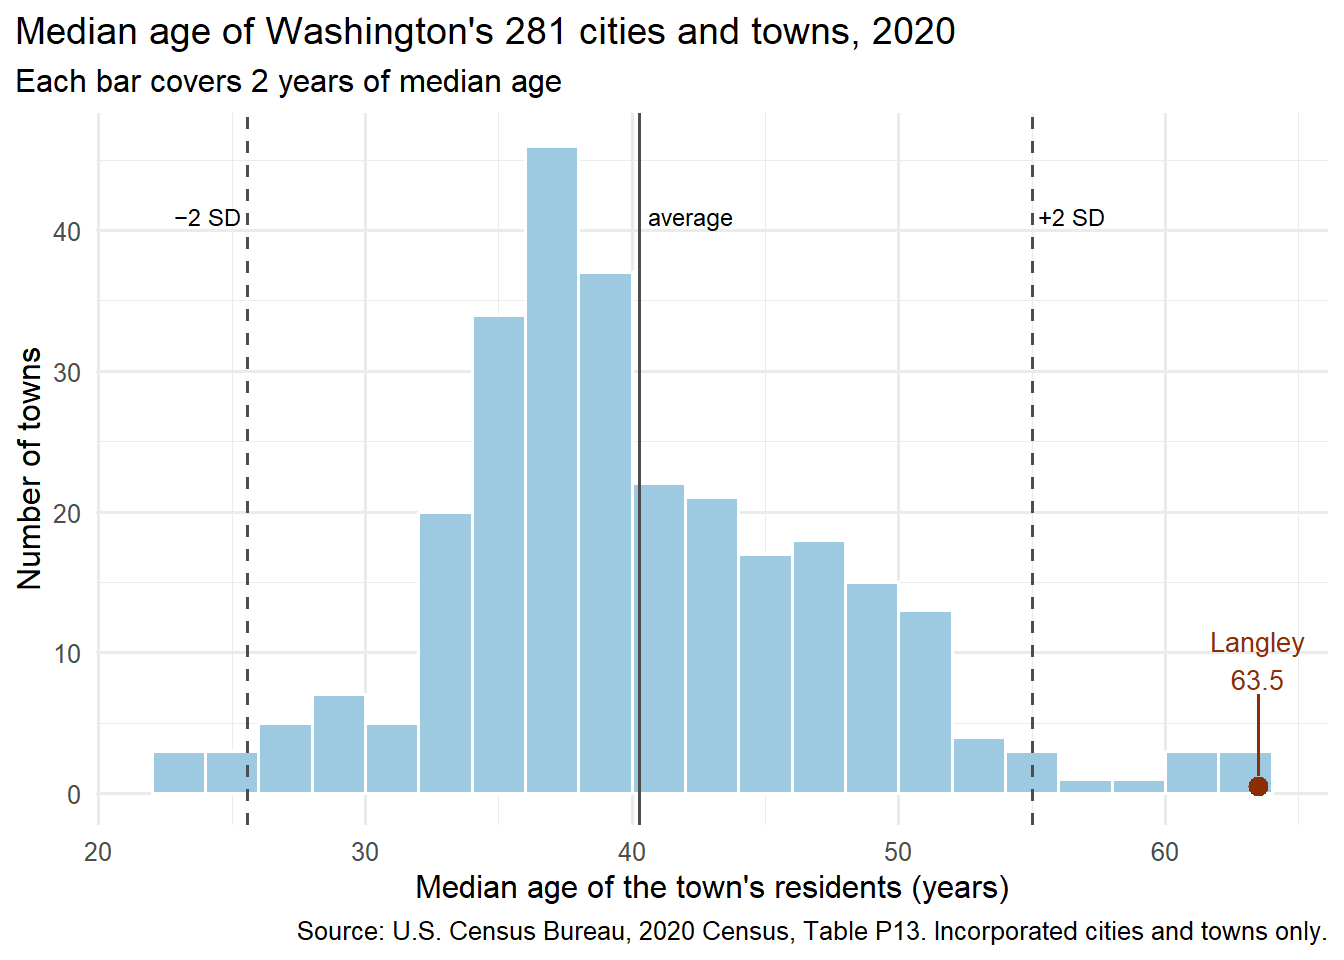
Across Washington’s 281 cities and towns, the average median age is 40.3, the median is 39.1, and the standard deviation is 7.35 years. The mean sits a little above the median because a handful of retirement towns pull it up, the same way a few big incomes pull up an average paycheck.
Langley is 63.5 − 40.3 = 23.2 years above the average. Divided by 7.35 years per standard deviation, that’s 3.2 standard deviations above the average town. Only Sequim (63.7) was older.
Show the code
ggplot(towns, aes(x = median_age)) +geom_histogram(binwidth =2, boundary =0, fill ="#9ecae1", colour ="white") +geom_vline(xintercept = m +c(-2, 0, 2) * s, linetype =c("dashed", "solid", "dashed"), colour ="grey30") +annotate("point", x = langley, y =0.5, colour ="#8c2d04", size =3) +annotate("segment", x = langley, xend = langley, y =1.2, yend =7, colour ="#8c2d04") +annotate("text", x = langley, y =9.5, label ="Langley\n63.5", colour ="#8c2d04", size =3.5) +annotate("text", x = m, y =41, label ="average", hjust =-0.1, size =3.2) +annotate("text", x = m +2* s, y =41, label ="+2 SD", hjust =-0.1, size =3.2) +annotate("text", x = m -2* s, y =41, label ="−2 SD", hjust =1.1, size =3.2) +labs(x ="Median age of the town's residents (years)", y ="Number of towns",title ="Median age of Washington's 281 cities and towns, 2020",subtitle ="Each bar covers 2 years of median age",caption ="Source: U.S. Census Bureau, 2020 Census, Table P13. Incorporated cities and towns only.") +theme_minimal(base_size =12) +theme(plot.title.position ="plot")
Does the “68–95–99.7” rule work here?
My class teaches two rules for how much data sits near the average:
The Empirical Rule: if the data are roughly bell-shaped, about 68% fall within 1 standard deviation of the average, 95% within 2, and 99.7% within 3.
Chebyshev’s rule: for any shape, at least 75% fall within 2 standard deviations and at least 88.9% within 3. It’s a floor, not a prediction.
Show the code
k <-1:3data.frame(within =paste(k, "SD"),towns_actually =paste0(round(100*sapply(k, function(x) mean(abs(towns$median_age - m) < x * s)), 1), "%"),empirical_rule =c("68%", "95%", "99.7%"),chebyshev_at_least =c("(no promise)", "75%", "88.9%"))
Within … of the average
Towns, actually
Empirical Rule says
Chebyshev promises at least
1 standard deviation
72.2%
about 68%
(nothing)
2 standard deviations
95.0%
about 95%
75%
3 standard deviations
98.9%
about 99.7%
88.9%
The Empirical Rule comes surprisingly close, because most towns pile up in one hill, highest in the high 30s. But the tails are fatter than a perfect bell: three towns are more than 3 standard deviations out, where the rule expects fewer than one. Two of the three are on the Olympic Peninsula and the coast. The third is Langley.
How sure can we be?
The Census numbers above are full counts, so there’s no margin of error. The survey (ACS) is newer, but it’s a sample, and Langley is small. Here’s what happens when you put them side by side:
Show the code
kids <-subset(ages, area %in%c("Langley", "South Whidbey School District") & period %in%c("2020", "2020-24"))kids$range_90 <-ifelse(is.na(kids$under18_moe), "full count",paste0(kids$under18_pct - kids$under18_moe, "% to ", kids$under18_pct + kids$under18_moe, "%"))kids[, c("area", "period", "source", "median_age", "median_moe", "under18_pct", "range_90")]
2020 Census (count)
2020–24 survey (sample)
Langley, median age
63.5
69.4, give or take 5.0
Langley, share under 18
12.0% (138 kids)
4.9%, give or take 2.8
South Whidbey School District, share under 18
13.4%
12.8%, give or take 1.7
The Census Bureau’s “give or take” is a margin of error at 90% confidence. If the survey were repeated many times, about 90% of the ranges built this way would contain the true value. Like every margin of error, it assumes the sample was drawn fairly, like names from a hat.
For the whole school district, about 16,900 people, the two sources agree. For Langley, about 1,100 people, they don’t: the survey’s range (2.1% to 7.7% kids) doesn’t reach the 2020 count (12.0%). Either kids really left Langley after 2020, or a few dozen survey households in a tiny town gave a lopsided picture. The data can’t tell which. What both sources agree on is the direction: older, with fewer kids.
The survey would also put Langley’s median age at 69.4, which would make it the oldest city or town in Washington. With a margin of error of 5 years, I can’t say that. I can say it was second-oldest in the 2020 count, by two-tenths of a year.
One more thing the school numbers taught me: Langley city is only about 7% of the school district’s people. Most of South Whidbey’s kids live outside town limits, in a district that’s old too: its median age is about 58, according to the survey.
The class words for what I found
Class term
In this post
Median
Langley’s median age, 63.5 in 2020: half of residents were older
Mean
The average of all 281 towns’ median ages, 40.3
Resistant
The median isn’t pulled by a few extreme ages; the mean is
Skew
Mean 40.3 above median 39.1: a few retirement towns stretch the right tail
Standard deviation
The typical distance from the average: 7.35 years across Washington towns
Standard deviations from the mean
Langley: (63.5 − 40.3) ÷ 7.35 = 3.2
Empirical Rule vs. Chebyshev
72% / 95% / 99% of towns within 1 / 2 / 3 SD, vs. about 68 / 95 / 99.7 and at least – / 75 / 88.9
Full count vs. sample
The Census counts everyone; the ACS samples, so it carries a margin of error
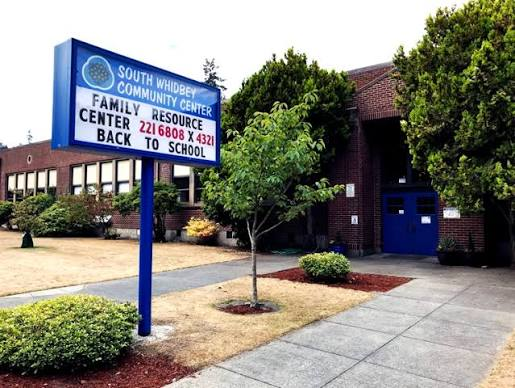
The South Whidbey Community Center in Langley, formerly Langley Middle School, which closed in 2017. Photo courtesy of a friend, used with permission.
What I’ll remember next Halloween
The Halloween I remember best, I was Spider-Man. I was 7 or 8, so it was 2000 or 2001, right around the years South Whidbey’s schools were at their fullest. I went out with two friends, one dressed as a fairy and one as a werewolf. Kids moved up and down the street in packs of eight or ten, with flashlights bobbing everywhere. I came home with a full bucket and ate enough of it to get canker sores for a week or two. It was worth it.
Now I barely see a flashlight on the road. Most of the people who come to the door are teenagers or in their early 20s. Some years it feels like I’m handing candy to adults. Then again, I’m older too.
I don’t want to be the person who says the town was better in the old days. Towns change for a lot of reasons, and I think affordability is the biggest one. I’ll come back to housing in a later post.
Why my memory was off. I guessed 900 students the year I graduated. The records say 527. I think my 900 wasn’t really a memory. It was my picture of what a normal high school looks like, and I filled in the gap with it. 527 students is about 130 per grade, and I mostly hung out with five or six people. The rest of the school I saw all at once, in the cafeteria or packed into the gym for a meet, and a crowd is hard to count.
The middle school. I never went to Langley Middle School; I went to a private school on the island. So I wasn’t here for the closure, and I wasn’t surprised by it. You could tell for years that it was shrinking. What surprised me was that people protested the closing without asking the bigger question: why aren’t there enough kids here to keep it open?
My shifts. Between about 7:30 a.m. and noon or 1 p.m., nearly everyone I serve is over 50. From September through March, it’s almost all older people. In summer I see middle-aged parents with young kids. Teenagers I almost never see. Some of that may just be how kids spend their time now. When I started high school in 2007, smartphones hadn’t caught on yet, so you saw people in person whether you wanted to or not.
Working here. Langley is a service town. If a business doesn’t do well enough in the summer tourist season, it won’t make it through the winter. I’ve worked with someone who commuted from North Seattle, and I know businesses in town that hire people from Everett. It’s a hard industry.
If you’re thinking of moving here with kids, here’s what I’d tell you. It’s safe and quiet, with a lot of nature and time outdoors. I’d give the schools about a 6 out of 10, and for the early years that can be fine. But there isn’t much for kids to do. When I was in high school, around 2010 and 2011, the opioid epidemic was near its peak, and I saw prescription painkillers going around at school. People who only visit the island don’t see that side of it. I don’t know what it’s like now, and I’m sure it’s changed.
My honest advice: by high school, think about getting your kid off the island. Keep the house or the land if you can, but let them grow up somewhere with more opportunities and more connection to the wider world. An island with no road to the mainland can make a quiet kid quieter. I know people who are still here 20 years later and never managed to leave. I also know people who left, saw the world and decided to come back. That’s the version I’d hope for: coming back because you want to, not because you never left.
National Center for Education Statistics, Common Core of Data district search, South Whidbey School District (NCES ID 5308190). Screenshot Oct. 7, 2026. Older years pulled through the Urban Institute’s Education Data Portal, which republishes the same federal data.↩︎