Everyone on Whidbey Knows the Power Is Going Out. Is It a Sure Thing?
2026-11-08
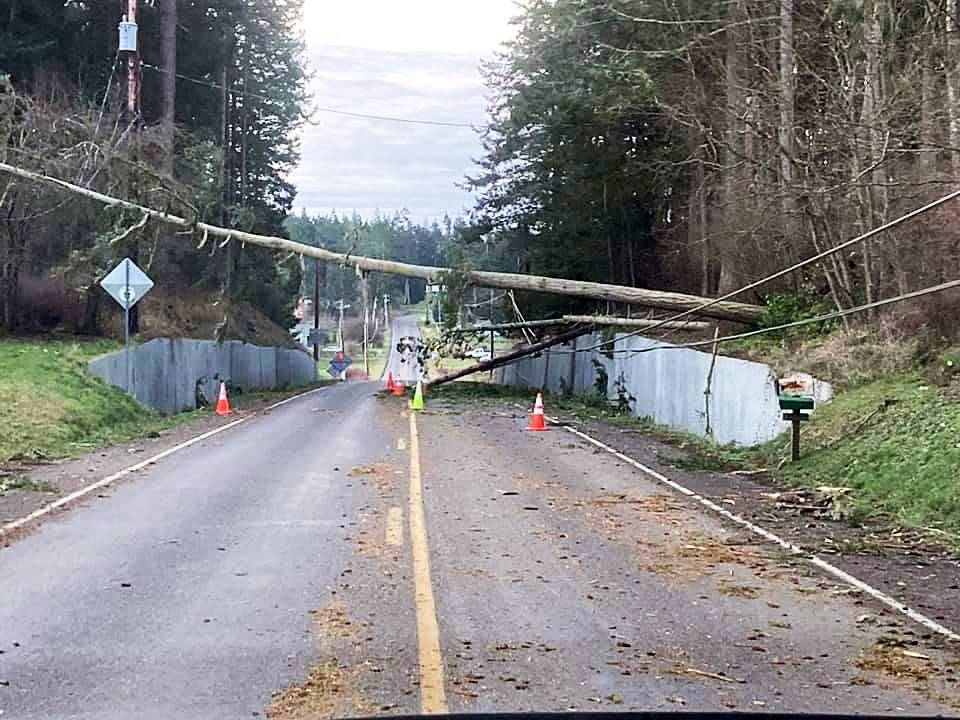
A windstorm snapped a power pole and dropped a tree across the lines. Photo: Davin Fladager-McCullough.
Class topic: MATH& 146, Sections 5.1–5.4 — probability, the addition rule, independence and the multiplication rule, and conditional probability.
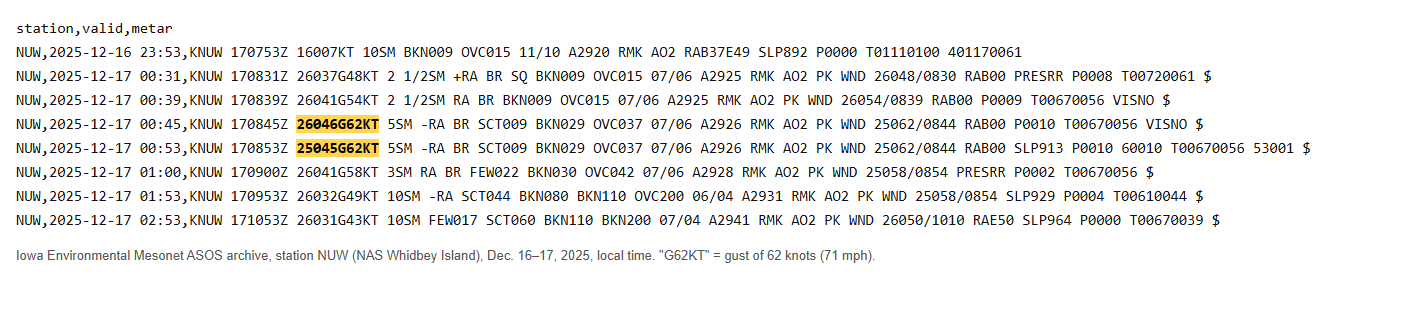
Last December 17, just after midnight, the wind at the Navy base on north Whidbey hit 71 mph. More than 25,000 customers on the island lost power, per FOX 13. About 1,600 were still in the dark on Dec. 19, per MyNorthwest.
Nobody here was surprised. On Whidbey, losing power isn’t an event so much as a season. Every fall we charge the phones, charge the batteries and wait for the wind that takes the power out.
This winter has a twist. The tropical Pacific is running far warmer than normal, and NOAA’s Climate Prediction Center says a strong-to-very-strong El Niño is likely through early 2027.1 And Seattle meteorologist Cliff Mass has written that big Northwest windstorms tend to skip strong El Niño winters.2
So I asked: is a big windstorm on Whidbey really a sure thing every winter? And does a Super El Niño change the odds?
Where the numbers come from
The wind. The weather station at Naval Air Station Whidbey Island, in Oak Harbor, sends out a weather report at least once an hour, day and night. Each report lists the steady wind speed and any gusts. The Iowa Environmental Mesonet at Iowa State University keeps every one of these airport reports.3 I pulled all of them for 30 winters: October through March, from 1996–97 (the winter my family moved here) to 2025–26. That’s every report, not a sample.
The Dec. 17, 2025 storm in the station’s own reports. “26046G62KT” means wind from the west at 46 knots, gusting to 62 knots (71 mph), at 12:45 a.m. Highlighting mine.4
What counts as a “big” wind? I used the National Weather Service’s own lines for our area:5
Weather Service alert
Gusts of at least
What it usually means here
Wind Advisory
46 mph
branches down, scattered outages
High Wind Warning
58 mph
trees down, widespread outages
For each day I kept the strongest gust in any report. A winter “had a big wind” if at least one day reached the line.
The El Niño index. NOAA’s official measure is now the Relative Oceanic Niño Index. I used its November–January value for each winter: +0.5 or more is an El Niño winter, −0.5 or less is La Niña, and in between is neutral.6
The outages. Oak Ridge National Laboratory runs EAGLE-I, which checks utility outage maps every 15 minutes and logs how many customers are out in each county.7 Its Island County records start in August 2015 and run through 2025.
Two limits up front. Oak Harbor is about 25 miles north of my house in Langley, on open water, so it’s windier than most of the island. And one weather station is one spot. It tells me how often the island gets hit, not exactly what hit my street.
What I did in R
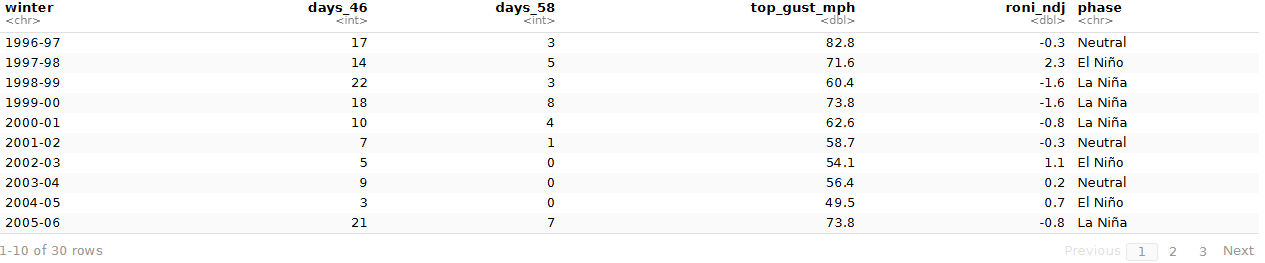
My winters in R (the first 10 of 30 rows): big-wind days per winter, the top gust, and each winter’s El Niño index and phase.
Show the code
w <-read.csv("winters.csv") # one row per winter, built by prepare-data.Rw[, c("winter", "days_46", "days_58", "top_gust_mph", "roni_ndj", "phase")]
    winter days_46 days_58 top_gust_mph roni_ndj   phase
1  1996-97      17       3         82.8     -0.3 Neutral
2  1997-98      14       5         71.6      2.3 El Niño
3  1998-99      22       3         60.4     -1.6 La Niña
4  1999-00      18       8         73.8     -1.6 La Niña
5  2000-01      10       4         62.6     -0.8 La Niña
6  2001-02       7       1         58.7     -0.3 Neutral
7  2002-03       5       0         54.1      1.1 El Niño
8  2003-04       9       0         56.4      0.2 Neutral
9  2004-05       3       0         49.5      0.7 El Niño
10 2005-06      21       7         73.8     -0.8 La Niña
11 2006-07      21       4         64.4      0.9 El Niño
12 2007-08      20       1         62.1     -1.6 La Niña
13 2008-09       7       0         56.4     -0.9 La Niña
14 2009-10      20       1         61.0      1.5 El Niño
15 2010-11      14       1         59.8     -1.5 La Niña
16 2011-12      19       0         57.5     -1.0 La Niña
17 2012-13       7       0         55.2     -0.3 Neutral
18 2013-14      13       2         63.3     -0.3 Neutral
19 2014-15      16       1         67.9      0.6 El Niño
20 2015-16      15       3         64.4      2.3 El Niño
21 2016-17      13       1         71.6     -0.9 La Niña
22 2017-18      14       2         58.7     -1.1 La Niña
23 2018-19      11       0         55.2      0.8 El Niño
24 2019-20      15       0         52.9      0.2 Neutral
25 2020-21      17       3         69.3     -1.4 La Niña
26 2021-22      13       1         61.0     -1.2 La Niña
27 2022-23      17       1         62.1     -1.0 La Niña
28 2023-24      17       5         64.4      1.4 El Niño
29 2024-25      35      12         64.4     -1.0 La Niña
30 2025-26      28       2         71.3     -1.0 La Niña
Is the storm a sure thing?
A probability is how often something happens out of all the chances it had. When I count it from records like these, it’s an empirical probability: what actually happened, divided by how many times it could have.
Show the code
data.frame(event =c("At least one 46+ mph day", "At least one 58+ mph day"),winters_it_happened =c(sum(w$days_46 >0), sum(w$days_58 >0)),out_of = n_w,probability =round(c(mean(w$days_46 >0), mean(w$days_58 >0)), 2))
                     event winters_it_happened out_of probability
1 At least one 46+ mph day                  30     30        1.00
2 At least one 58+ mph day                  22     30        0.73
At the advisory line, yes: 30 of 30 winters had at least one 46-mph day. The windy day really is a sure thing.
At the warning line, not quite. 22 of 30 winters had a 58-mph day, a probability of 0.73. About one winter in four stayed under it. The quiet ones were 2002-03, 2003-04, 2004-05, 2008-09, 2011-12, 2012-13, 2018-19, 2019-20.
November or December?
The season runs roughly November through February. So how often does a big wind land in the first stretch, before the new year? The addition rule gives the chance of one thing or another: add the two chances, then subtract the chance of both, so winters with both aren’t counted twice.
P(Nov or Dec) = P(Nov) + P(Dec) − P(Nov and Dec)
Show the code
big <-subset(d, gust_58) # days with a 58+ mph gusthad <-function(m) w$winter_end %in% big$winter_end[big$month == m]nov <-had("Nov"); dec <-had("Dec")c(P_nov =mean(nov), P_dec =mean(dec), P_both =mean(nov & dec),addition_rule =mean(nov) +mean(dec) -mean(nov & dec),counted_directly =mean(nov | dec))
A 58-mph day came in November in 37% of winters and in December in 30%. Both months had one in 13%. So the chance of at least one in November or December is 37% + 30% − 13% = 53%. Counting those winters directly gives the same answer, which is the point of the rule.
Do windy days come alone?
Here’s a way to predict the chance of a big-wind winter. Out of all 5,452 winter days, 71 reached 58 mph. That’s a chance of about 0.013 on any given day.
If every day were independent (one day’s wind tells you nothing about the next, like separate coin flips), the multiplication rule says the chance of a whole winter with no big day is that day’s “no” chance multiplied 182 times. One minus that is the chance of at least one.
Show the code
p_day <-mean(d$gust_58) # share of all winter days with a 58+ mph gustc(p_day =round(p_day, 4),predicted_if_independent =round(1- (1- p_day)^182, 2),what_actually_happened =round(mean(!quiet), 2))
The coin-flip model predicts 91%. The real number is 73%. The model is too sure, because windy days aren’t independent. They come in bunches: one storm blows for two days, and an active winter sends storm after storm. Winter 2024–25 alone had 12 of them. When the big days pile into a few winters, more winters are left with none.
Quiet winters bunch up too. If winters were independent, two quiet ones in a row would happen with chance 0.27 × 0.27 = 0.07.
It actually happened in 4 of 29 pairs, or 0.14. With so few quiet winters, that’s a hint, not proof.
Does El Niño buy us a quiet winter?
Conditional probability is a chance given something you already know. You only count the winters that fit what you know. P(quiet given El Niño) means: of the El Niño winters, how many were quiet?
Show the code
w$el_nino <-ifelse(w$phase =="El Niño", "El Niño winter", "Other winter")w$quiet <-ifelse(quiet, "No 58+ mph day", "Had one")table(w$el_nino, w$quiet)
                 Had one No 58+ mph day
  El Niño winter       6              3
  Other winter        16              5
P(quiet) = 8/30 = 0.27
P(quiet given El Niño) = 3/9 = 0.33
P(quiet given not El Niño) = 5/21 = 0.24
Two events are independent if knowing one doesn’t change the chance of the other. Here, knowing it’s an El Niño winter nudges the chance of a quiet winter from 0.27 to 0.33. That’s a small change, based on only 9 El Niño winters. One more quiet winter or one fewer would swing it a lot.
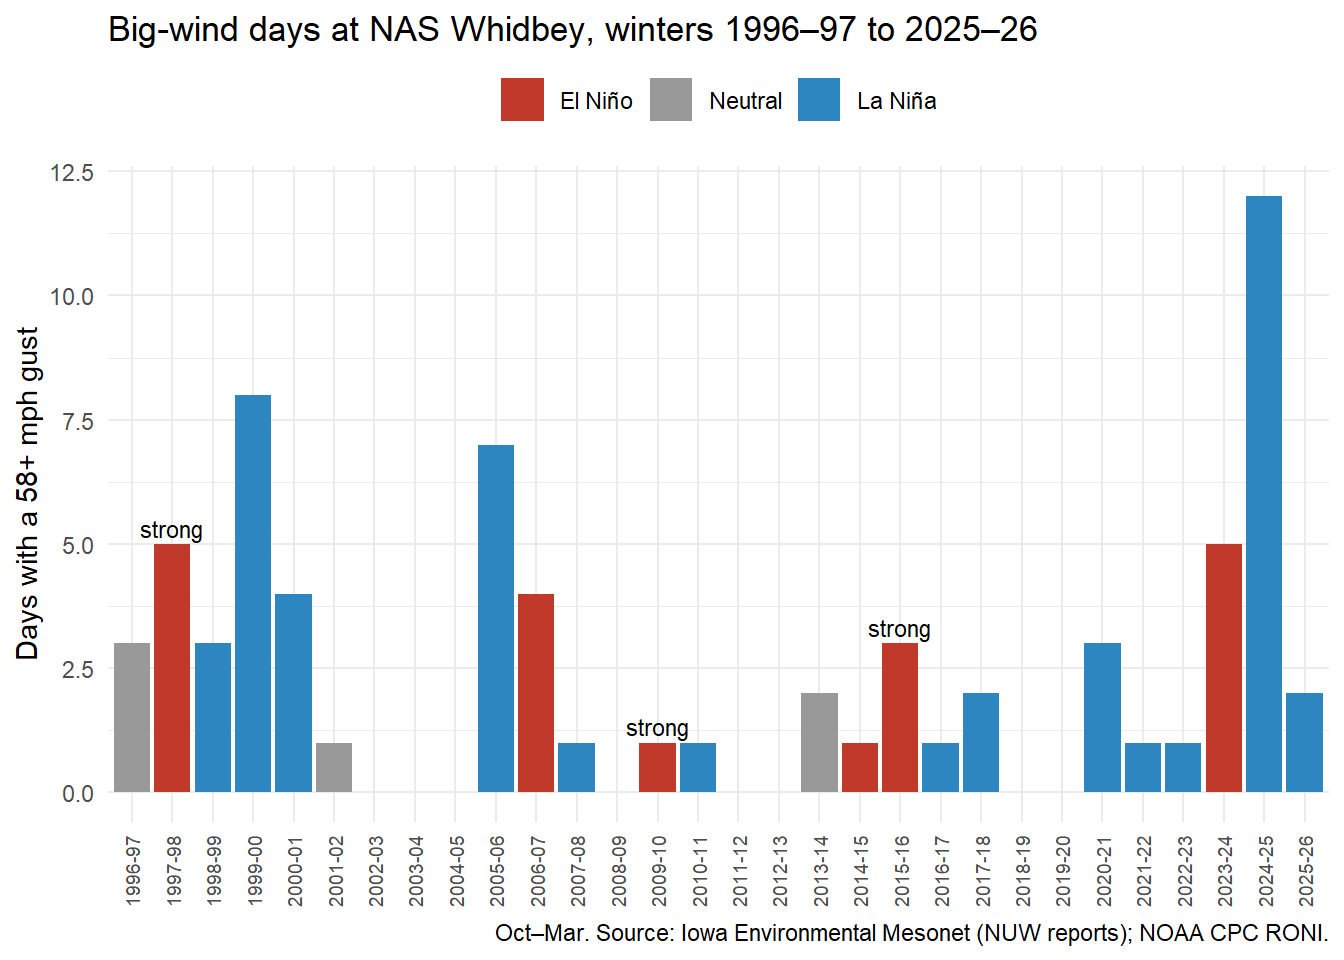
The surprise is in the strong El Niños, the ones like this year. Three winters in my 30 had an index of 1.5 or more: 1997-98, 2009-10, 2015-16. All 3 still had a 58-mph day (5, 1, 3 of them). The quiet El Niño winters were the weak-to-moderate ones.
Show the code
library(ggplot2)w$phase <-factor(w$phase, levels =c("El Niño", "Neutral", "La Niña"))ggplot(w, aes(x = winter, y = days_58, fill = phase)) +geom_col() +geom_text(data =subset(w, roni_ndj >=1.5), aes(label ="strong"), vjust =-0.4, size =3) +scale_fill_manual(values =c("El Niño"="#c0392b", "Neutral"="grey60", "La Niña"="#2e86c1")) +labs(x =NULL, y ="Days with a 58+ mph gust", fill =NULL,title ="Big-wind days at NAS Whidbey, winters 1996–97 to 2025–26",caption ="Oct–Mar. Source: Iowa Environmental Mesonet (NUW reports); NOAA CPC RONI.") +theme_minimal() +theme(axis.text.x =element_text(angle =90, vjust =0.5, size =7), legend.position ="top")
Why doesn’t this match Cliff Mass? He was talking about the region’s rare, historic storms, the kind that make the history books. My line is a 58-mph gust at one windy airfield. A Super El Niño may well lower the odds of a once-in-a-generation storm. In 30 winters, it hasn’t stopped Whidbey from getting a warning-level gust.
But does the wind actually knock the power out?
A gust is just a number until the lights go out. So I matched every winter day to the outage log: the most Island County customers out at any 15-minute check that day. EAGLE-I has Island County from August 2015, so this covers winter days from October 2015 to December 2025.
I called it an outage day if 1,000 or more customers were out at once. That’s my line, not an official one. It’s big enough to be more than one tree on one line.
Every winter day matched to that day’s outage count, then sorted by the top gust.
Show the code
d <-read.csv("nuw-daily-peak-wind.csv"); d$date <-as.Date(d$date) # daily top gusto <-read.csv("island-outages-daily.csv"); o$date <-as.Date(o$date) # daily most customers outx <-subset(d, date >=as.Date("2015-10-01") & date <=as.Date("2025-12-31"))x$out <- o$max_customers_out[match(x$date, o$date)]x$out[is.na(x$out)] <-0# no row in the log = nobody out (or a gap in collection)x$outage <- x$out >=1000x$wind <-factor(ifelse(x$gust_58, "58+ mph", ifelse(x$gust_46, "46–57 mph", "Under 46 mph")),levels =c("Under 46 mph", "46–57 mph", "58+ mph"))tab <-table(x$wind, x$outage)data.frame(gust_that_day =rownames(tab), days =rowSums(tab), outage_days = tab[, "TRUE"],P_outage_given_gust =round(tab[, "TRUE"] /rowSums(tab), 2), row.names =NULL)
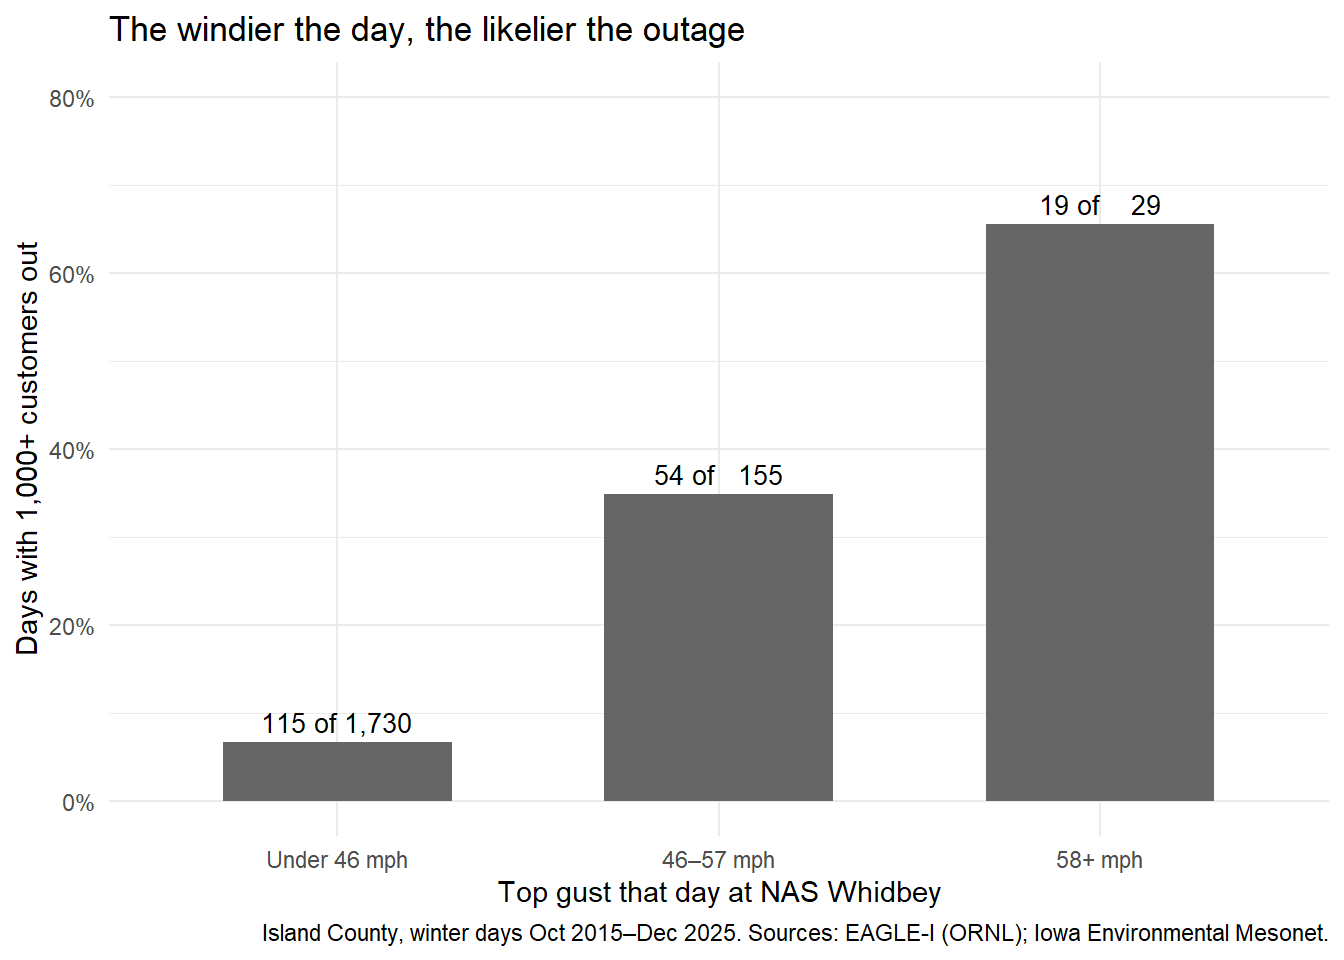
The pattern is as clear as anything I’ve found for this blog:
P(outage given a 58+ mph gust) = 19/29 = 0.66
P(outage given a 46–57 mph gust) = 54/155 = 0.35
P(outage given calmer wind) = 115/1,730 = 0.07
Wind and outages are clearly not independent: knowing the gust changes the chance of an outage by a factor of almost ten. Last December 17, EAGLE-I logged 47,704 Island County customers out at once.
Show the code
p <-data.frame(wind =levels(x$wind),share =as.vector(tapply(x$outage, x$wind, mean)),label =paste(tapply(x$outage, x$wind, sum), "of", format(as.vector(table(x$wind)), big.mark =",")))p$wind <-factor(p$wind, levels =levels(x$wind))ggplot(p, aes(x = wind, y = share)) +geom_col(fill ="grey40", width =0.6) +geom_text(aes(label = label), vjust =-0.5, size =3.5) +scale_y_continuous(labels =function(v) paste0(round(100* v), "%"), limits =c(0, 0.8)) +labs(x ="Top gust that day at NAS Whidbey", y ="Days with 1,000+ customers out",title ="The windier the day, the likelier the outage",caption ="Island County, winter days Oct 2015–Dec 2025. Sources: EAGLE-I (ORNL); Iowa Environmental Mesonet.") +theme_minimal()
Now flip the question. Of the days with an outage, how many had a 46-mph gust? P(46+ gust given an outage) = 0.39. That’s not the same number as P(outage given a 46+ gust), and it isn’t close. This is the trap my class warned about: a “given” switched around is a different question. Most outage days didn’t have a big gust at Oak Harbor that day. Some were the day after a storm, with crews still restoring power. Some had wind that hit south Whidbey or Camano harder than the Navy base. Some had nothing to do with wind.
And the folk wisdom? Every winter in the outage log had outage days: from 8 to 30 of them (2025–26 counted through December only).
How confident can I be?
Full count, small numbers. These are all the reports, not a sample, so there’s no margin of error. But 30 winters is not many. Three strong El Niños is far too few to promise anything about this one.
One station. Oak Harbor sits on open water at the north end of the island. South Whidbey can have a big storm the station misses, or the reverse.
My lines. The answers depend on 46 and 58 mph. At 57 mph, a few “quiet” winters would flip. Winter 2011–12 topped out at 57.5.
Older reports aren’t comparable. Before 1996 the archive holds far fewer gust reports, so I started there.
The outage log grew. Island County’s biggest outage each winter jumps from 4,000–15,000 customers in the winters through 2018–19 to 24,000–48,000 every winter since. That probably reflects better tracking of utility outage maps, not worse storms, so I don’t compare years. The log also can’t tell “nobody out” from “no data that day,” and Island County includes Camano Island, which gets its power from Snohomish County PUD, not PSE.
Typos. I dropped 6 reports where a huge “gust” came with almost no steady wind (like a 98-knot gust with a 6-knot wind).
The class words for what I found
Term
In this post
Empirical probability
22 of 30 winters had a 58-mph day: 0.73
Addition rule
P(Nov or Dec) = P(Nov) + P(Dec) − P(both)
Independence
Windy days aren’t independent: they bunch up, so the coin-flip model overshoots
Multiplication rule
Chance of no big day all winter, if days were independent: (1 − p)^182
Conditional probability
P(outage given a 58+ mph gust) = 0.66; P(quiet winter given El Niño) = 0.33
Reversed “given”
P(46+ gust given an outage) = 0.39 is a different question from P(outage given a 46+ gust)
The November 2024 “bomb cyclone” spinning off the Pacific Northwest coast on Nov. 19, 2024, seen by the VIIRS instrument on NOAA-20 (JPSS-1). That day, EAGLE-I logged more than 15,000 Island County customers out, and winter 2024–25 went on to have 12 days with 58-mph gusts at NAS Whidbey, the most in my 30 winters. Image: NASA Earth Observatory, public domain, via Wikimedia Commons.
What I’ll remember when the lights go out
On the island, nobody really calls it “the windstorm.” It’s more like a season. Sometime between November and February, the power in Langley goes out for a day, a day and a half, sometimes two. You just know it’s coming.
How do you know? You feel it. If the wind is blowing hard, that’s the signal. There are so many trees on this island that once the wind gets to a certain speed, branches come down on the lines. It’s close to a certainty. Getting ready is simple: charge every device, charge the batteries and have them ready to go.
If I remember right, Langley used to have its own generator. It was sold 15 or 20 years ago, I think because it cost too much to keep up. Since then, plenty of people have bought generators or battery backups. That’s not a complaint about the line crews. It just feels a little ridiculous that after all these years, we still can’t keep the power on through a Puget Sound winter. This year I’m thinking about a power bank, at least for the fridge. A fridge full of food is hundreds of dollars, and it can go bad.
My longest outage was when I was 8 or 9 at most, in November or early December. The power was out for about four and a half days in the dead of winter. That was an awkward time for technology. Phones weren’t what they are now, and nobody had a personal power bank. Most people had a gas stove, a gas fireplace or a wood stove, which helped. It was miserable. You could sit in your car to warm up if you had gas to spare, or heat a pan on the stove and put it in your bed. Now at least there are phones and tablets to pass the time, electric blankets that run off a power bank, and hot water bottles you can fill from the stove.
The cold isn’t what it used to be, either. It feels like we rarely get a real snow anymore. Most winters it stays a few degrees above freezing, and the most we get is slush.
Who gets the power back first is its own mystery. People watch PSE’s outage map, and over the years you get a feel for the order. Two neighborhoods on South Whidbey can sit on opposite sides of Highway 525, and one gets power back a day after the other, while people farther north are back in six to eight hours. Even inside Langley, downtown can come back while homes a few blocks away wait a couple more hours. I’d guess people out in the boonies wait the longest. A few businesses, like the main grocery store and a restaurant or two, have their own full-size generators, because they have freezers full of stock. How PSE decides who goes first is a question I’d like to dig into someday.
Last December’s storm? Honestly, I barely remember it. It’s just something you live through every year. I think we were out about a day and a half.
Will a Super El Niño change how I prepare? Probably not. If I lived somewhere that got brutally cold, maybe. But this is a mild place, without many extreme highs or lows, and not much snow in the last decade. More than anything, it’s the boredom that gets you.
NOAA Climate Prediction Center, ENSO Diagnostic Discussion, Oct. 8, 2026: “El Niño continues to strengthen, with a strong-to-very strong El Niño likely through January-March 2027.”↩︎
Cliff Mass Weather Blog, “Improved chances for a big Northwest windstorm”, Oct. 3, 2024. He found strong windstorms “never occurred for strong El Ninos and La Nina” in records back to 1860, with most in neutral years.↩︎
Iowa Environmental Mesonet, Iowa State University, ASOS/METAR archive, station NUW (Whidbey Island NAS). Downloaded Nov. 8, 2026.↩︎
Iowa Environmental Mesonet, Iowa State University, ASOS/METAR archive, station NUW (Whidbey Island NAS). Downloaded Nov. 8, 2026.↩︎
National Weather Service Seattle, Watch/Warning/Advisory criteria, non-mountain zones: Wind Advisory gusts 45–57 mph; High Wind Warning gusts 58 mph or more. I used 46 mph as the advisory line, the first whole mph above 45.↩︎