Cars lined up at the Mukilteo toll booths on a Saturday in September 2025. Photo: SounderBruce, Sept. 6, 2025, CC BY-SA 4.0, via Wikimedia Commons.
Class topic: MATH& 146, Sections 3.4–3.5 — z-scores, percentiles, quartiles, the interquartile range, outliers, the five-number summary and boxplots.
Say my boat leaves 20 minutes late. Should I be surprised?
I ride Mukilteo–Clinton most days: a morning boat out of Clinton, an afternoon boat home from Mukilteo. Twenty minutes late in the morning would feel strange. Twenty minutes late on a July afternoon feels like Tuesday.
That gut feeling is a statistics question. “Unusual” isn’t a fixed number of minutes. It depends on what’s normal for that boat, at that time, in that season. My class just gave me tools for measuring exactly that. Then the tools turned up something I didn’t expect: on summer afternoons, the usual rule for spotting unusual delays no longer flags any at all.
Where the numbers come from
Washington State Ferries records how many minutes late every sailing leaves. The boats carry transponders, and a system matches their actual departure to the schedule. WSF posts the results on its public dashboard.1 I downloaded my route’s records for an earlier post: about 168,000 sailings, January 2020 through June 2026.
This isn’t a sample. It’s every recorded sailing, so there’s no margin of error. The limits are about what the system fails to record, and that turns out to matter a lot here. I come back to it below.
What I did in R
I picked out the two boats I actually ride:
My morning boat: leaving Clinton, 6 to 10 a.m.
My afternoon boat: leaving Mukilteo, 1 to 7 p.m.
I looked at each in two seasons: summer 2025 (June–August, the latest full summer in the data) and winter 2025–26 (December–February). That’s four groups.
My four groups in R and how many sailings are in each.
Show the code
sailings <-read.csv("../2026-09-28-ferry-runs-late/muk-clinton-sailings.csv")all_sailings <- sailings # every scheduled sailing, kept for counting gapssailings <-subset(sailings, !is.na(delay_min)) # keep sailings with a recorded delay# My commute: the morning boat from Clinton (6-10 am), the afternoon boat home from Mukilteo (1-7 pm)morning <- sailings$direction =="From Clinton"& sailings$clock_min >=360& sailings$clock_min <600afternoon <- sailings$direction =="From Mukilteo"& sailings$clock_min >=780& sailings$clock_min <1140summer25 <- sailings$year ==2025& sailings$month %in%6:8winter26 <- (sailings$year ==2025& sailings$month ==12) | (sailings$year ==2026& sailings$month %in%1:2)sailings$group <-NAsailings$group[morning & winter26] <-"Winter morning"sailings$group[afternoon & winter26] <-"Winter afternoon"sailings$group[morning & summer25] <-"Summer morning"sailings$group[afternoon & summer25] <-"Summer afternoon"commute <-subset(sailings, !is.na(group))commute$group <-factor(commute$group, levels =c("Winter morning", "Summer morning","Winter afternoon", "Summer afternoon"))table(commute$group)
Next I lined up each group’s delays from smallest to largest and pulled out five numbers. Together they’re called the five-number summary:
the minimum and maximum: the earliest and latest departure;
the median: the middle sailing, half left earlier and half later;
the first quartile (Q1): a quarter of sailings left at or before this;
the third quartile (Q3): three quarters left at or before this.
The gap between Q1 and Q3 is the interquartile range (IQR): how spread out the middle half of sailings is. The IQR is also the yardstick for an outlier, a value far enough from the rest to deserve a second look. The usual rule draws a fence 1.5 IQRs above Q3. Anything past the fence counts as an outlier.
The five-number summary, IQR and upper fence for each group, and how many sailings landed past the fence.
(R and my textbook find quartiles in slightly different ways. With this many sailings, they give the same numbers here.)
Four boxes, four ideas of “normal”
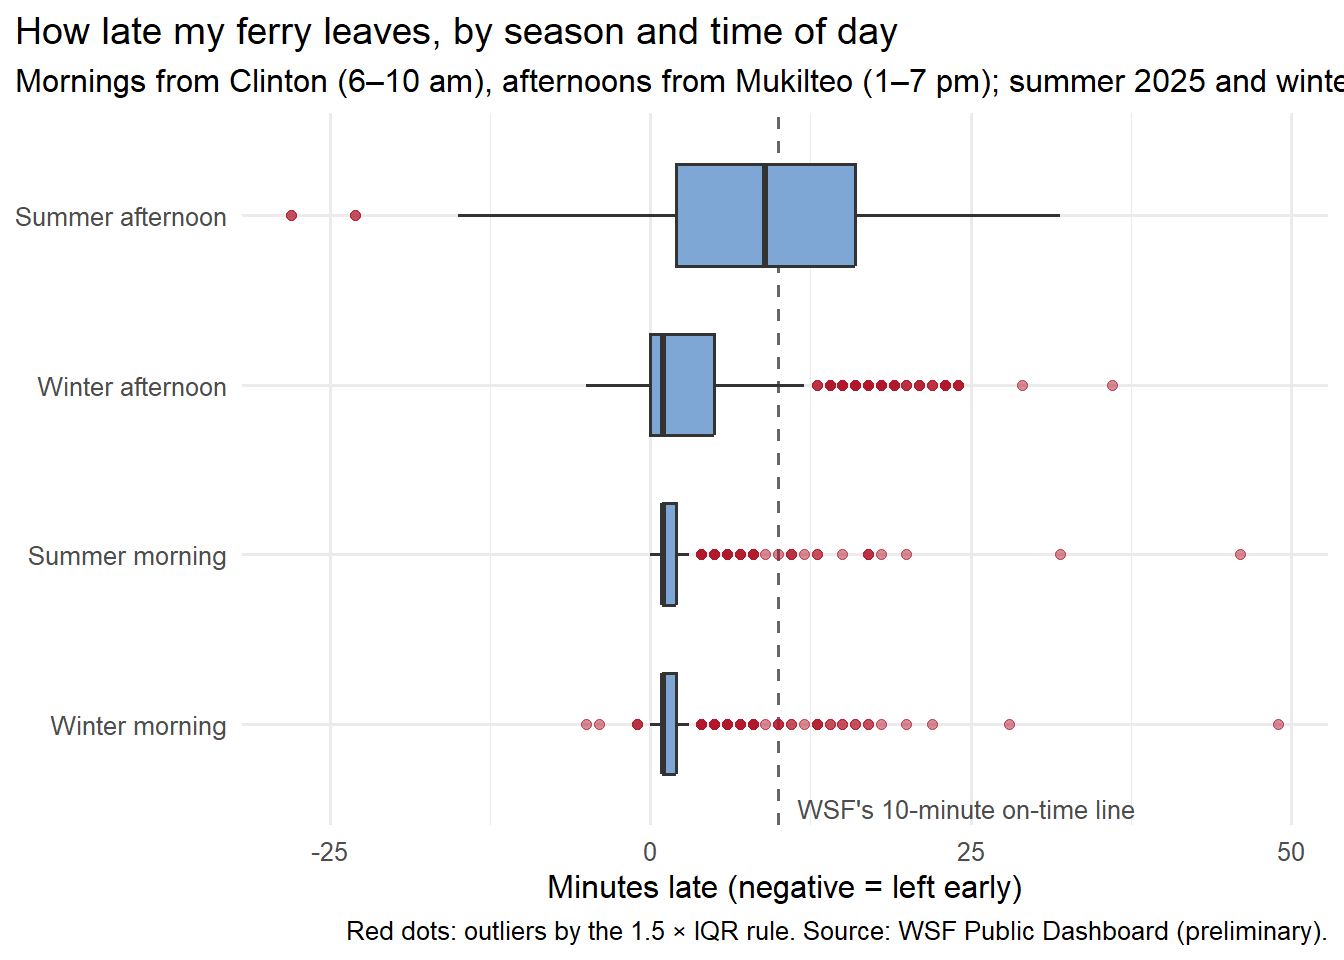
A boxplot draws the five-number summary. The box runs from Q1 to Q3, so it holds the middle half of sailings. The thick line inside is the median. The whiskers reach out to the latest and earliest sailings that aren’t outliers, and each outlier gets its own dot.
Show the code
library(ggplot2)ggplot(commute, aes(x = group, y = delay_min)) +geom_hline(yintercept =10, linetype ="dashed", colour ="grey40") +geom_boxplot(fill ="#7fa7d6", outlier.colour ="#b2182b", outlier.alpha =0.5, width =0.6) +annotate("text", x =0.5, y =11.5, label ="WSF's 10-minute on-time line", hjust =0, size =3.4, colour ="grey30") +coord_flip() +labs(x =NULL, y ="Minutes late (negative = left early)",title ="How late my ferry leaves, by season and time of day",subtitle ="Mornings from Clinton (6–10 am), afternoons from Mukilteo (1–7 pm); summer 2025 and winter 2025–26",caption ="Red dots: outliers by the 1.5 × IQR rule. Source: WSF Public Dashboard (preliminary).") +theme_minimal(base_size =12) +theme(plot.title.position ="plot")
The two morning boxes are so thin they’re nearly lines. Half of all morning sailings left within a minute or two of schedule, summer or winter. With a middle half that tight, the fence sits at 3.5 minutes. Anything 4 minutes late or more counts as an outlier, and that’s more than one in ten morning sailings (78 in winter, 73 in summer).
That shows a limit of the rule. A 4-minute delay is not news to anyone standing on the dock. The fence is a rule of thumb: it means “look at this,” not “something went wrong.”
Winter afternoons sit in between: middle half from on time to 5 minutes late, fence at 12.5.
Then there’s the summer afternoon box. The middle half runs from 2 to 16 minutes late, and the median, 9 minutes, sits just under WSF’s 10-minute line. The box is so wide that the fence lands at 37 minutes. The latest recorded sailing in the group left 32 minutes late. Not one late sailing crossed the fence.
The boxes also differ in shape. The summer afternoon box is close to symmetric: the median sits in the middle, 7 minutes from each end of the box, and the average (8.95 minutes) is almost the same as the median (9). The other three are skewed right: most sailings bunch up near on time, and a long tail of late ones stretches out to the right. That tail pulls their averages above their medians.
So is 20 minutes late unusual?
Two class tools answer that directly.
A z-score measures how far a value is from the average in standard deviations, the typical distance from the mean. A z-score of 2 means “two typical distances above average.” A percentile says what share of values are at or below it.
Show the code
stats <-aggregate(delay_min ~ group, data = commute,FUN =function(x) c(mean =mean(x), sd =sd(x), share_20_or_less =mean(x <=20)))stats <-do.call(data.frame, stats); names(stats) <-c("group", "mean", "sd", "share_20_or_less")stats$z_for_20 <- (20- stats$mean) / stats$sd # z-score: how many SDs above that group's meanstats$percentile_20 <-100* stats$share_20_or_less # share of sailings at or below 20 minutes latedata.frame(group = stats$group, mean =round(stats$mean, 1), sd =round(stats$sd, 1),z_for_20 =round(stats$z_for_20, 2), percentile_20 =round(stats$percentile_20, 1))
On my summer morning boat, 20 minutes late is about six standard deviations above average. Out of 694 sailings, only two left later. That’s a strange day.
On my summer afternoon boat, the same 20 minutes is 1.26 standard deviations above average. Nine in ten afternoon sailings left at or before 20 minutes late, so one in ten left later. That’s the 90th percentile: unlucky, not strange.
One caution: z-scores and standard deviations are pulled around by extreme values and lopsided data. Here they agree with the boxplots, which is reassuring. When they don’t, I’d trust the median and quartiles.
The box kept stretching
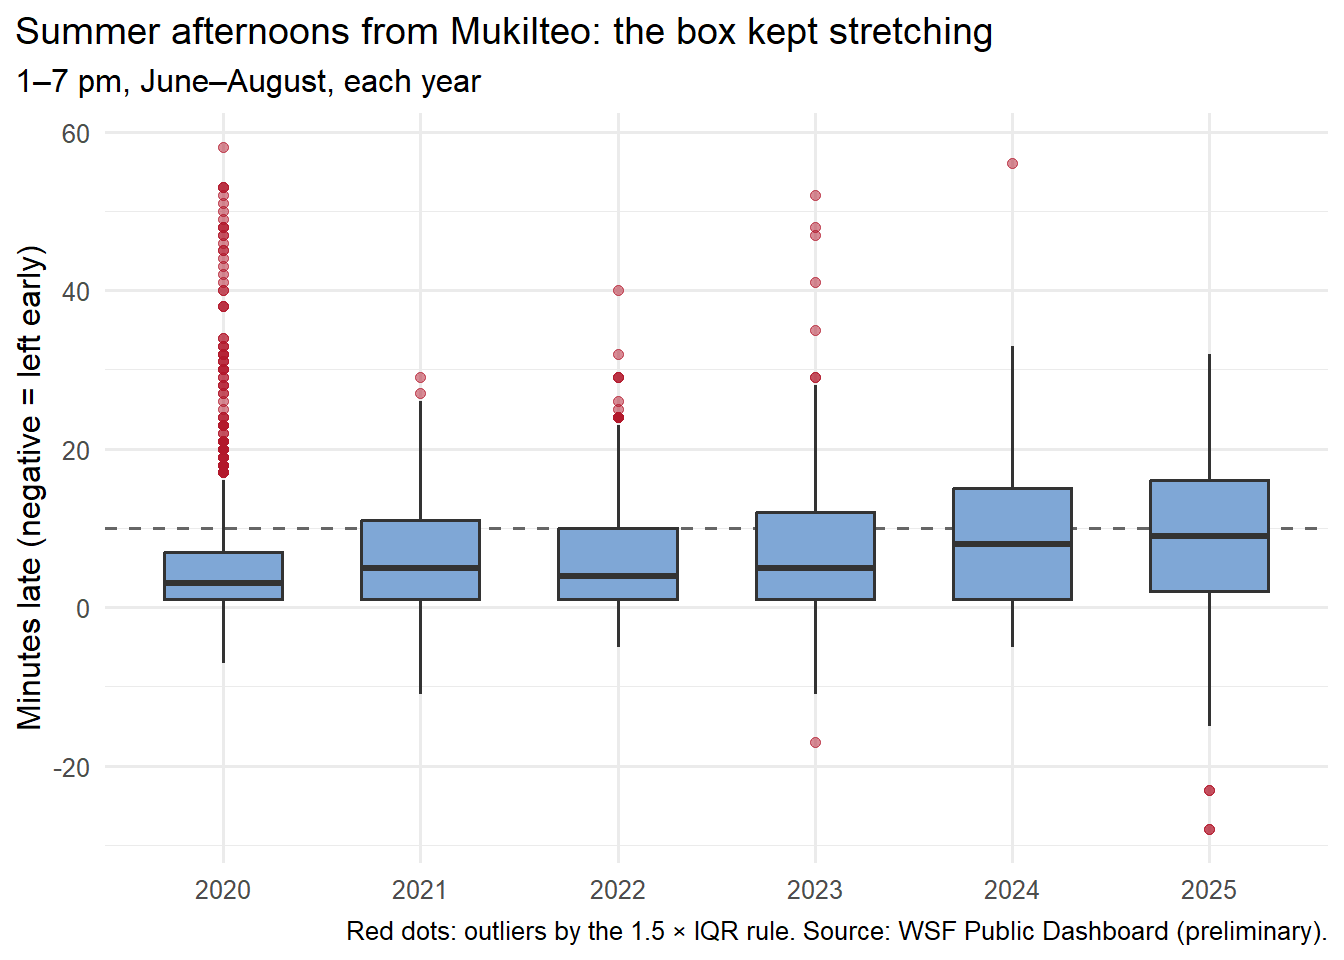
So when did late stop being unusual? I drew the summer afternoon box for every year since 2020.
Show the code
aft_summers <-subset(sailings, direction =="From Mukilteo"& clock_min >=780& clock_min <1140& month %in%6:8& year <=2025)ggplot(aft_summers, aes(x =factor(year), y = delay_min)) +geom_hline(yintercept =10, linetype ="dashed", colour ="grey40") +geom_boxplot(fill ="#7fa7d6", outlier.colour ="#b2182b", outlier.alpha =0.5, width =0.6) +labs(x =NULL, y ="Minutes late (negative = left early)",title ="Summer afternoons from Mukilteo: the box kept stretching",subtitle ="1–7 pm, June–August, each year",caption ="Red dots: outliers by the 1.5 × IQR rule. Source: WSF Public Dashboard (preliminary).") +theme_minimal(base_size =12) +theme(plot.title.position ="plot")
Show the code
by_year <-t(sapply(split(aft_summers$delay_min, aft_summers$year), five_num))all_aft <-subset(all_sailings, direction =="From Mukilteo"& clock_min >=780& clock_min <1140& month %in%6:8& year <=2025)no_delay <-tapply(is.na(all_aft$delay_min), all_aft$year, mean) # share with no recorded delaycbind(by_year[, c("median", "Q3", "IQR", "upper_fence", "outliers_late")],pct_no_delay =round(100* no_delay, 1))
In summer 2020, the middle half of afternoon sailings left between 1 and 7 minutes late. Anything past 16 minutes was an outlier, and 99 sailings crossed that line. By 2025 the middle half ran from 2 to 16 minutes late, the fence had moved out to 37, and nothing crossed it.
That doesn’t mean bad delays went away. It means they became normal. The rule measures “unusual” against the middle half of the data. When the middle half itself runs late, a 25-minute delay no longer looks out of place.
What the records can’t see
The last column of that table is the biggest limit in this post. Some sailings have no recorded delay at all: the system couldn’t match the boat to the schedule. WSF’s own data notes say very late sailings are the most likely to go missing. On summer afternoons, that gap grew from about 3% of sailings in 2021–2022 to about 11% in 2024–2025 (115 of 1,098 sailings in 2025).
So “zero outliers in 2025” needs a big asterisk. If the missing sailings were the worst ones, some of them would have crossed the fence. I can’t tell how many, or whether some were canceled sailings rather than late ones.
What I’m more confident about is the stretched box. If the missing sailings were mostly very late, the real Q3 would be even later and the real box even wider. The main finding would get stronger, not weaker.
The sailings that “left early”
The summer afternoon boxplot has two red dots on the left: sailings that supposedly left 23 and 28 minutes early. Ferries don’t do that. Three of the four came on one evening, June 10, 2025, one after another (5:40, 6:10 and 6:40 p.m.). My guess is the system matched those boats to the wrong scheduled times. That’s what an outlier rule is good for: it points at records worth checking.
Those four records also show why my class calls the median and IQR resistant. A resistant measure barely moves when a few extreme values change. Watch what happens when I drop them:
Show the code
sa <-subset(commute, group =="Summer afternoon")$delay_minq <-quantile(sa, c(0.25, 0.75)); low_fence <- q[[1]] -1.5* (q[[2]] - q[[1]])sort(sa[sa < low_fence]) # the low outliers: "left early" by 20+ minutes
  measure all_sailings without_low_outliers
1    mean         8.95                 9.09
2      SD         8.75                 8.48
3  median         9.00                 9.00
4     IQR        14.00                14.00
Four records out of 983 moved the average from 8.95 to 9.09 minutes and the standard deviation from 8.75 to 8.48. The median stayed at 9 and the IQR at 14. With only four odd values the shift is small, but the pattern is the point: the median and quartiles ignore a few bad records, and the average and SD don’t.
The class words for what I found
Class term
In this post
Five-number summary
Summer afternoon 2025: −28, 2, 9, 16, 32 minutes
Quartiles
Q1 = 2, Q3 = 16: a quarter of sailings left at or before 2 minutes late, three quarters at or before 16
Interquartile range (IQR)
16 − 2 = 14 minutes: the spread of the middle half
Fences and outliers
Upper fence = Q3 + 1.5 × IQR = 37 minutes; no late sailing crossed it
Boxplot
Four groups side by side: the morning boxes are thin lines, the summer afternoon box is wide
Shape
Mornings skewed right (median 1, a long tail of late sailings); summer afternoons nearly symmetric (mean 8.95, median 9)
z-score
A 20-minute delay: about 6 SDs above average in the morning, 1.26 on a summer afternoon
Percentile
20 minutes late = the 90th percentile on summer afternoons
Resistant
Dropping 4 bad records moved the mean and SD, not the median or IQR
What I’ll remember at the Mukilteo dock
A late boat in the morning doesn’t bother me much. I get off at Mukilteo and walk to work. Being 5 or 10 minutes late isn’t great, but there’s no connection to make. Once I’m at work, I’m at work.
The afternoon is different. On the Clinton side I have a bus to catch, and if I miss it, the next one is about half an hour later. It matters even more on Fridays, when I pick up groceries at QFC on the mainland, where protein is cheaper. An extra half hour standing around with raw meat in a bag is its own problem.
Does 20 minutes late on a summer afternoon match how it feels on the dock? Pretty much. On this route, 20 minutes late is getting close to when the next boat is scheduled to leave, and that creates a strange situation. Say my boat is scheduled for 4:00 and my bus leaves Clinton at 4:30. If I reach the dock at 3:50, the 3:30 boat might still be there, 20 minutes late. If I take it, I wait maybe 15 or 20 minutes for the bus on the other side and get home 30 to 40 minutes sooner. If I wait for my own boat and it leaves 15 or 20 minutes late, a 12- or 13-minute crossing gets me in around 4:35, and the bus is gone.
So the most painful delay isn’t always the biggest one. A very late boat can almost turn back into an on-time boat for whoever happens to catch it. The middle-sized delay, the one that lands right on top of a bus departure, is the one that costs me.
The buses have some give. They’re fare-free and paid for with tax money, and I’ve seen drivers wait 2 or 3 minutes for a boat. My sense is that past that, waiting starts to throw off the bus schedule. At 5 p.m., with maybe 60 commuters walking off the ferry, a driver might leave at 5:05. At 1 p.m. on a Thursday, when the people walking off are heading to their cars or to a taxi with a suitcase, the bus leaves on time. It depends on who’s getting off. That’s my view from the dock; I don’t know how the bus system actually makes those calls.
What still bothers me about the data is where the lines get drawn. A boat 9 minutes late counts as on time. A boat 25 minutes late can feel on time to the person who catches it, because it’s leaving close to when the next boat should. The records keep score sailing by sailing. My afternoon runs on whichever boat I can get on and whether it beats the bus. Those aren’t the same thing, and the gap between them makes the numbers harder to read.
Sources:WSF Public Dashboard, On-Time Performance by sailing, Mukilteo–Clinton, January 2020 – June 2026 (preliminary), exported Sept. 26, 2026. Photo: SounderBruce, Wikimedia Commons, CC BY-SA 4.0, credited above. Data file:muk-clinton-sailings.csv in the earlier post’s folder, built by its prepare-data.R from the dashboard exports in data/raw/.
Washington State Ferries, WSF Public Dashboard (Tableau Public), On-Time Performance by sailing, data through June 30, 2026, labeled preliminary. Exported Sept. 26, 2026.↩︎