Intro statistics, one class topic at a time, applied to real data from Washington State, Seattle and the Puget Sound.
About
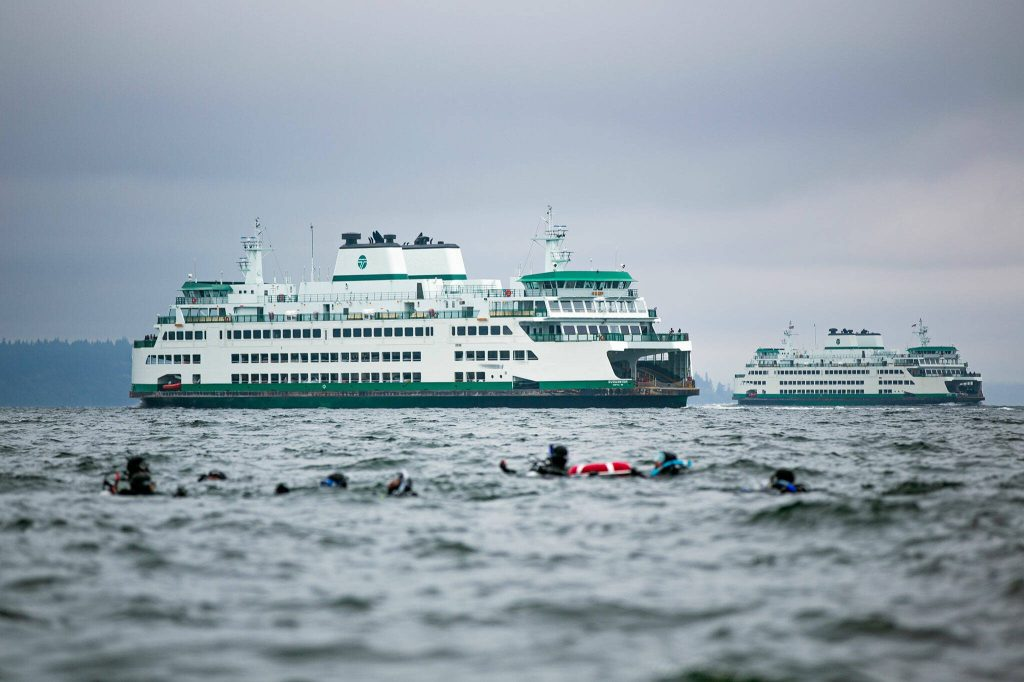
The 144-car boats ran more of the latest summer weeks. I split the data every way I could to see if that explains their delays. It mostly doesn’t, but a small paradox turned up inside August.
Packed boats do leave later, but the crowd explains less than I expected. How late the same boat left the other side explains about twice as much.
My boat left 20 minutes late. Is that strange? On my morning boat it’s way off the charts. On a summer afternoon it’s barely worth a shrug, and the outlier rule no longer flags anything at all.
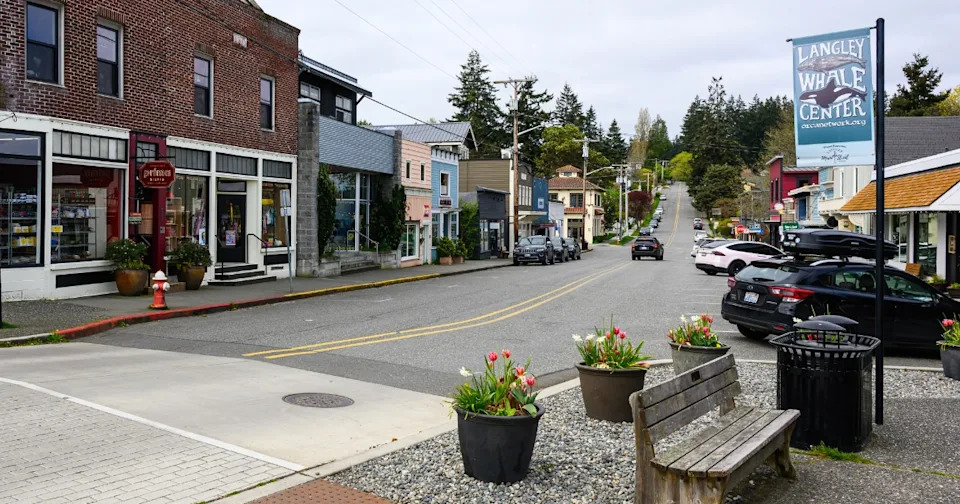
Halloween in Langley used to mean cars parked end to end and kids at the door every few minutes. Census counts and school records show what changed, and how far Langley sits from every other town in Washington.
Ten summers of official on-time reports for the Mukilteo–Clinton ferry. From the same numbers I can make three true headlines that point in opposite directions.
I thought the bigger boat on my route runs late. Six years of sailing records let me check, and showed me how many more summer sailings now leave late.
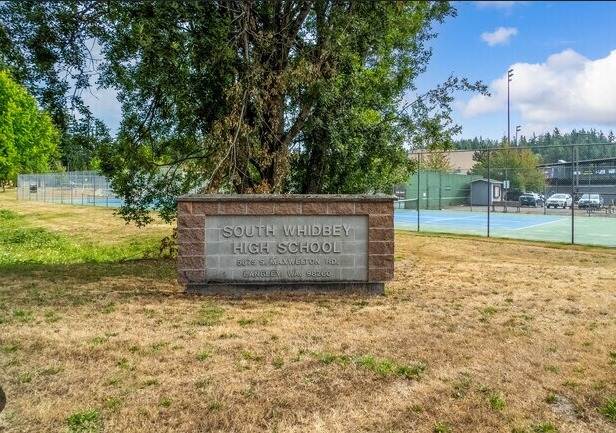
I went to a small rural high school on Whidbey Island. I used four sampling methods from class to see whether a statewide sample would pick it, and how much the method changes the answer.
My weekly ferry trip helped me see why a count of rides and a survey of people tell different stories.